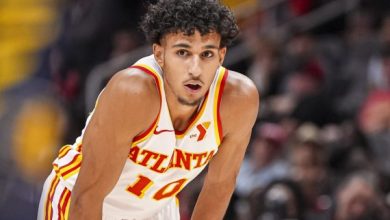
In difficulty on the first two games of the series in Boston, Trae Young counted on the change of scene to find colors, in front of its public of the State Farm Arena of Atlanta.
And the effect took place since the leader was much more effective during this Game 3, won by the Hawks.
Beyond his line of stats (32 points at 12/22 including 2/6 from afar, 9 assists and 6 rebounds), Trae Young above all attacked the Celtics’ defense much better, playing with his defenders and assists to shift his teammates in the first part of the match, before taking matters into their own hands directly in the last quarter.
With 15 points in the final round, 5/9 shooting, including extremely important baskets to avoid the Boston hold-up, it was the return of “Ice Trae”. At the best time for the Hawks and their fans!
When the 3-dot address goes…
And while his club intends to use this last part of the season to assess the future of the franchise, it was also the way for Trae Young to show the full potential of his duo with Dejounte Murray.
“At one point, I just said to myself that I had to shut up and let them be” admits Quin Snyder on his backcourt. “They had isolations where they created things for themselves and others, and it was just about the solutions that they had found. And the others feed on it. »
Solutions that allowed the Hawks to complete the match at 15/34 at 3-points, with in particular a big contribution from the bench (Saddiq Bey, Bogdan Bogdanovic, Jalen Johnson) in the field. The Celtics’ late assists and lack of impact also helped, and the Hawks probably won’t have as many openings in the next game.
In the meantime, they are back at 2-1 and will have the opportunity to reset the counters to zero on Sunday evening (01:00).
| Trae Young | Percentage | Bounces | |||||||||||||
|---|---|---|---|---|---|---|---|---|---|---|---|---|---|---|---|
| Season | Crew | GM | Minimum | Shots | 3 points | LF | Off | Def | Early | pd | party | Int | bp | CT | Points |
| 2018-19 | ATL | 81 | 31 | 41.8 | 32.4 | 82.9 | 0.8 | 2.9 | 3.7 | 8.1 | 1.7 | 0.9 | 3.8 | 0.2 | 19.1 |
| 2019-20 | ATL | 60 | 35 | 43.7 | 36.1 | 86.0 | 0.5 | 3.7 | 4.3 | 9.3 | 1.7 | 1.1 | 4.8 | 0.1 | 29.6 |
| 2020-21 | ATL | 63 | 34 | 43.8 | 34.3 | 88.6 | 0.6 | 3.3 | 3.9 | 9.4 | 1.8 | 0.8 | 4.1 | 0.2 | 25.3 |
| 2021-22 | ATL | 76 | 35 | 46.0 | 38.2 | 90.4 | 0.7 | 3.1 | 3.7 | 9.7 | 1.7 | 1.0 | 4.0 | 0.1 | 28.4 |
| 2022-23 | ATL | 73 | 35 | 42.9 | 33.5 | 88.6 | 0.8 | 2.2 | 3.0 | 10.2 | 1.4 | 1.1 | 4.1 | 0.1 | 26.2 |
| Total | 353 | 34 | 43.7 | 35.1 | 87.6 | 0.7 | 3.0 | 3.7 | 9.3 | 1.7 | 1.0 | 4.1 | 0.1 | 25.5 | |
How to read the stats? MJ = matches played; Min = Minutes; Shots = Shots made / Shots attempted; 3pts = 3-points / 3-points attempted; LF = free throws made / free throws attempted; Off = offensive rebound; Def= defensive rebound; Tot = Total bounces; Pd = assists; Fte: Personal fouls; Int = Intercepts; Bp = Lost bullets; Ct: Counters; Points = Points.