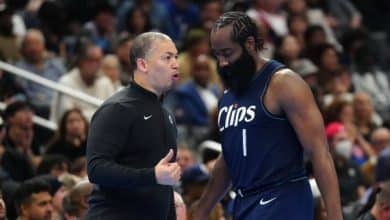
The Clippers are indeed the fittest team in the NBA. With seven consecutive victories, the Californians (15 wins – 10 losses) move up the standings in the Western Conference and Tyronn Lue is pleased with the emerging alchemy, particularly between Kawhi Leonard, Paul George And James Harden in the major five.
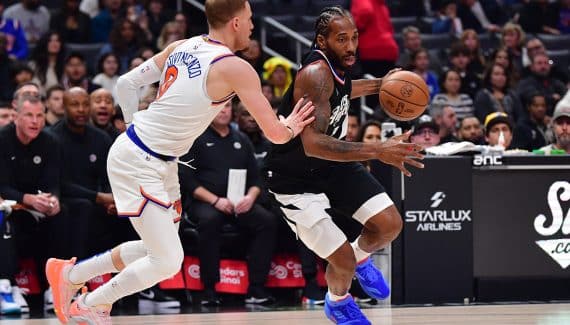
Against the Knicks, “The Beard” (10 points at 2/6, 12 assists) only had to put himself in distributor mode while Paul George (25 points) and Kawhi Leonard (36 points) stunned the weak defense from New York.
It must be said that “The Klaw” has been particularly effective lately. Over the last five Los Angeles games, he averaged 33.8 points, the fourth average in the league over the period (behind Giannis Antetokounmpo, Joel Embiid and Luka Doncic) but it is above all his shooting success percentages which are scary: 64.8% general address (57/88), 62.1% at 3-point (18/29) and 94.9% on the throw line (37/39).

We have to go back to January 2020 to find Kawhi Leonard as effective over a period of five games.
Focused on something bigger
Moreover, if we represent the number of points scored per minute over a period of five games, compared to TS% (which takes into account the effectiveness of 3-pointers and free throws), we realize that there are only two players who have been more effective than Kawhi Leonard, since the arrival of the line at 3-pointer in 1979.
These are Manu Ginobili (0.92 points per minute, 83 TS%) over five games in February 2008, including a performance of 46 points at 15/20 shooting including 8/11 from afar against LeBron James' Cavaliers. And Stephen Curry, twice. First over five matches in December 2015 (1.02 points per minute, 81.1 TS%), then in March 2021 (1.19 points per minute, 80.6 TS%).
Over the last five games, Kawhi Leonard is averaging 0.95 points per minute played, for a TS% of 80.4! His reaction ? “I’m focused on something bigger than this period.” Or the title.

| Kawhi Leonard | Percentage | Rebounds | |||||||||||||
|---|---|---|---|---|---|---|---|---|---|---|---|---|---|---|---|
| Season | Team | MJ | Min | Shots | 3pts | L.F. | Off | Def | Early | Pd | Party | Int | Bp | Ct | Pts |
| 2011-12 | SAN | 64 | 24 | 49.3 | 37.6 | 77.3 | 1.6 | 3.5 | 5.1 | 1.1 | 1.4 | 1.3 | 0.7 | 0.4 | 7.9 |
| 2012-13 | SAN | 58 | 31 | 49.4 | 37.4 | 82.5 | 1.1 | 4.9 | 6.0 | 1.6 | 1.7 | 1.7 | 1.1 | 0.6 | 11.9 |
| 2013-14 | SAN | 66 | 29 | 52.2 | 37.9 | 80.2 | 1.2 | 5.1 | 6.2 | 2.0 | 1.9 | 1.7 | 1.2 | 0.8 | 12.8 |
| 2014-15 | SAN | 64 | 32 | 47.9 | 34.9 | 80.2 | 1.3 | 5.9 | 7.2 | 2.5 | 2.0 | 2.3 | 1.5 | 0.8 | 16.5 |
| 2015-16 | SAN | 72 | 33 | 50.6 | 44.3 | 87.4 | 1.3 | 5.5 | 6.9 | 2.6 | 1.9 | 1.8 | 1.5 | 1.0 | 21.2 |
| 2016-17 | SAN | 74 | 33 | 48.5 | 38.0 | 88.0 | 1.1 | 4.7 | 5.8 | 3.5 | 1.7 | 1.8 | 2.1 | 0.7 | 25.5 |
| 2017-18 | SAN | 9 | 23 | 46.8 | 31.4 | 81.6 | 0.7 | 4.0 | 4.7 | 2.3 | 1.0 | 2.0 | 1.8 | 1.0 | 16.2 |
| 2018-19 | TOR | 60 | 34 | 49.6 | 37.1 | 85.4 | 1.3 | 6.0 | 7.3 | 3.3 | 1.5 | 1.8 | 2.0 | 0.4 | 26.6 |
| 2019-20 | LAKE | 57 | 32 | 47.0 | 37.8 | 88.6 | 1.0 | 6.1 | 7.1 | 4.9 | 2.0 | 1.8 | 2.6 | 0.6 | 27.1 |
| 2020-21 | LAKE | 52 | 34 | 51.2 | 39.8 | 88.5 | 1.1 | 5.4 | 6.5 | 5.2 | 1.6 | 1.6 | 2.0 | 0.4 | 24.9 |
| 2022-23 | LAKE | 52 | 34 | 51.2 | 41.6 | 87.1 | 1.1 | 5.4 | 6.5 | 3.9 | 1.6 | 1.4 | 1.7 | 0.5 | 23.8 |
| 2023-24 | LAKE | 24 | 35 | 50.5 | 42.3 | 86.1 | 1.0 | 4.9 | 5.9 | 3.5 | 1.5 | 1.5 | 1.5 | 0.7 | 23.5 |
| Total | 652 | 32 | 49.6 | 38.9 | 85.9 | 1.2 | 5.2 | 6.4 | 3.0 | 1.7 | 1.7 | 1.6 | 0.6 | 19.8 | |
How to read the stats? MJ = matches played; Min = Minutes; Shots = Successful shots / Attempted shots; 3pts = 3-points / 3-points attempted; LF = free throws made / free throws attempted; Off = offensive rebound; Def=defensive rebound; Tot = Total rebounds; Pd = assists; Fte: Personal fouls; Int = Intercepts; Bp = Lost balls; Ct: Against; Pts = Points.