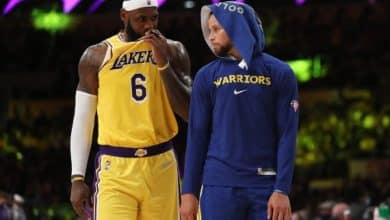
With 36% shooting success and 13% at 3-points, Chris Paul has been very clumsy since the start of the season. But the All-Star leader makes up for it with a statistic pointed out by Steve Kerr at a press conference. “He has 62 assists for 6 lost balls. That’s crazy “admires the Bay coach.
This makes a pass/lost ball ratio of 10.3! It’s huge and only Mike Conley is currently doing better (26) but the Wolves player, who has only lost one ball this season, has distributed “only” 26 assists.
“He has excellent shooters to serve. He’s very good at doing that.”analyzes Bruce Fraser, assistant coach at Golden State, for Sportskeeda. “In addition to the talent around him, he has integrated very well into our style. He is in a comfort zone which allows him not to go too fast. He likes this style. »
31 assists in a row without losing a ball!
Result: Chris Paul has not lost a ball in four matches, including the 13th game against Oklahoma City. If we go into detail, the former Rockets or Suns player has 31 assists delivered in a row without wasting a single possession. It’s exceptional and it’s valuable for Golden State, which has had a bad habit of wasting a lot of ammunition for years.
“He has an impact on the whole team. He is excellent in a general role on the floor. He knows how to find the right players at the right time,” comments Bruce Fraser again. “It helps Klay Thompson, Jonathan Kuminga and we can do the whole list. Chris Paul is an additional passer and we therefore have one more player to direct the game. He can relieve Stephen Curry of this work. Before, we had Draymond Green and Andre Iguodala, who are different players. Paul is a cerebral person who can score. There, he hasn’t shot well yet but he can do it. He not only made Stephen Curry better, the whole team is. »
| Chris Paul | Percentage | Rebounds | |||||||||||||
|---|---|---|---|---|---|---|---|---|---|---|---|---|---|---|---|
| Season | Team | MJ | Min | Shots | 3pts | L.F. | Off | Def | Early | Pd | Party | Int | Bp | Ct | Pts |
| 2005-06 | NOP | 78 | 36 | 43.0 | 28.2 | 84.7 | 0.8 | 4.4 | 5.1 | 7.8 | 2.8 | 2.2 | 2.4 | 0.1 | 16.1 |
| 2006-07 | NOP | 64 | 37 | 43.7 | 35.0 | 81.8 | 0.8 | 3.5 | 4.4 | 8.9 | 2.4 | 1.8 | 2.5 | 0.1 | 17.3 |
| 2007-08 | NOP | 80 | 38 | 48.8 | 36.9 | 85.1 | 0.8 | 3.2 | 4.0 | 11.6 | 2.3 | 2.7 | 2.5 | 0.1 | 21.1 |
| 2008-09 | NOP | 78 | 39 | 50.3 | 36.4 | 86.8 | 0.9 | 4.7 | 5.5 | 11.0 | 2.7 | 2.8 | 3.0 | 0.1 | 22.8 |
| 2009-10 | NOP | 45 | 38 | 49.3 | 40.9 | 84.7 | 0.4 | 3.8 | 4.2 | 10.7 | 2.6 | 2.1 | 2.5 | 0.2 | 18.7 |
| 2010-11 | NOP | 80 | 36 | 46.3 | 38.8 | 87.8 | 0.5 | 3.6 | 4.1 | 9.8 | 2.5 | 2.4 | 2.2 | 0.1 | 15.9 |
| 2011-12 | LAKE | 60 | 36 | 47.8 | 37.1 | 86.1 | 0.7 | 2.9 | 3.6 | 9.1 | 2.3 | 2.5 | 2.1 | 0.1 | 19.8 |
| 2012-13 | LAKE | 70 | 33 | 48.1 | 32.8 | 88.5 | 0.8 | 3.0 | 3.7 | 9.7 | 2.0 | 2.4 | 2.3 | 0.1 | 16.9 |
| 2013-14 | LAKE | 62 | 35 | 46.7 | 36.8 | 85.5 | 0.6 | 3.7 | 4.3 | 10.7 | 2.5 | 2.5 | 2.3 | 0.1 | 19.1 |
| 2014-15 | LAKE | 82 | 35 | 48.5 | 39.8 | 90.0 | 0.6 | 4.0 | 4.6 | 10.2 | 2.5 | 1.9 | 2.3 | 0.2 | 19.1 |
| 2015-16 | LAKE | 74 | 33 | 46.2 | 37.1 | 89.6 | 0.5 | 3.7 | 4.2 | 10.0 | 2.5 | 2.1 | 2.6 | 0.2 | 19.5 |
| 2016-17 | LAKE | 61 | 32 | 47.6 | 41.1 | 89.2 | 0.7 | 4.3 | 5.0 | 9.2 | 2.4 | 2.0 | 2.4 | 0.1 | 18.1 |
| 2017-18 | HOU | 58 | 32 | 46.0 | 38.0 | 91.9 | 0.6 | 4.8 | 5.4 | 7.9 | 2.4 | 1.7 | 2.2 | 0.2 | 18.6 |
| 2018-19 | HOU | 58 | 32 | 41.9 | 35.8 | 86.2 | 0.6 | 4.0 | 4.6 | 8.2 | 2.5 | 2.0 | 2.6 | 0.3 | 15.6 |
| 2019-20 | OKAY | 70 | 32 | 48.9 | 36.5 | 90.7 | 0.4 | 4.6 | 5.0 | 6.7 | 2.3 | 1.6 | 2.3 | 0.2 | 17.6 |
| 2020-21 | PHX | 70 | 31 | 49.9 | 39.5 | 93.4 | 0.4 | 4.1 | 4.5 | 8.9 | 2.4 | 1.4 | 2.2 | 0.3 | 16.4 |
| 2021-22 | PHX | 65 | 33 | 49.3 | 31.7 | 83.7 | 0.3 | 4.0 | 4.4 | 10.8 | 2.1 | 1.9 | 2.4 | 0.3 | 14.7 |
| 2022-23 | PHX | 59 | 32 | 44.0 | 37.5 | 83.1 | 0.5 | 3.8 | 4.3 | 8.9 | 2.1 | 1.5 | 1.9 | 0.4 | 13.9 |
| 2023-24 | GOS | 8 | 28 | 36.0 | 13.8 | 85.7 | 0.3 | 3.6 | 3.9 | 7.8 | 1.1 | 1.5 | 0.8 | 0.0 | 8.8 |
| Total | 1221 | 34 | 47.1 | 36.7 | 87.0 | 0.6 | 3.9 | 4.5 | 9.5 | 2.4 | 2.1 | 2.4 | 0.2 | 17.9 | |
How to read the stats? MJ = matches played; Min = Minutes; Shots = Successful shots / Attempted shots; 3pts = 3-points / 3-points attempted; LF = free throws made / free throws attempted; Off = offensive rebound; Def=defensive rebound; Tot = Total rebounds; Pd = assists; Fte: Personal fouls; Int = Intercepts; Bp = Lost balls; Ct: Against; Pts = Points.